Guides
How to use BLS painter wage data to set pay in your metro
OEWS metro percentiles for occupation 47-2141 turn into pay bands, then into a bid labor rate you can defend line by line with local wage data.
What to take away
- Occupation 47-2141, painters and coating workers, construction and maintenance, is the row you pull in OEWS tables. Paperhangers and automotive refinishers sit in other codes.
- Metro percentiles beat the national average. The 25th and 75th bracket where most of your hiring lands.
- Bands need a floor, a ceiling and written criteria. Years in the trade alone will not move a painter up.
- A bid labor rate is the band wage plus payroll taxes, workers' comp, benefits and non-billable hours, divided by billable hours.
- QCEW shows what painting contractors in your county report paying. When it disagrees with OEWS, find out why before you post a wage.
What the OEWS tables report for painters
The Bureau of Labor Statistics runs the Occupational Employment and Wage Statistics program, shortened to OEWS. It surveys employers and publishes wage estimates by occupation, industry and geography. Painters are occupation 47-2141.
That code covers brush, roller and spray work on buildings and structures. Bridge painters, maintenance painters and industrial coating applicators are inside it. Paperhangers, automotive refinishers and powder coating machine operators are not, so do not blend those wages into a painter scale.
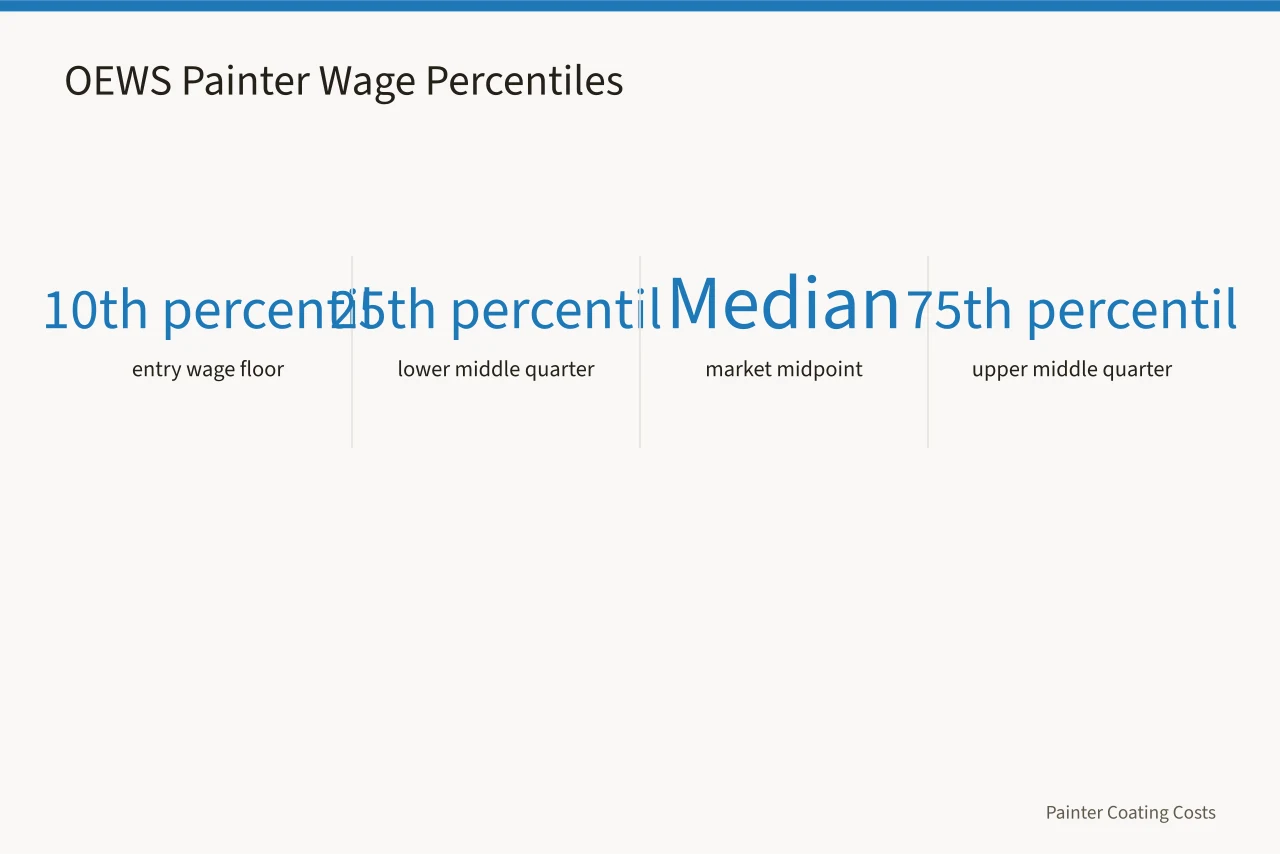
Each area gets an employment count, a location quotient and hourly and annual wages at the 10th, 25th, median, 75th and 90th percentiles. The median is the midpoint. The 90th is the top of the market. The 25th and 75th bracket the middle half, which is where most of your hiring lands.
You can see the full Occupational Employment and Wage Statistics (OEWS) Tables : U.S. Bureau of Labor Statistics for every state and metro. That page is where you pull the painter rows for your own market.
OEWS also splits by industry. Look for painters employed by building finishing contractors, the code most painting companies fall under. A painter working for a school district or a manufacturer often earns differently from one working for a contractor.
Two limits matter. OEWS wages are straight-time hourly wages, so overtime, premium pay, tips and most fringe benefits are excluded. The self-employed are excluded too, which means the sole proprietor bidding against you never appears in the table. Treat these figures as a base wage floor and ceiling, not as your full labor cost.
The Painters, Construction and Maintenance : Occupational Outlook Handbook: : U.S. Bureau of Labor Statistics gives the same occupation a plain treatment, with median pay, typical entry-level education and the projected job outlook.
OEWS models small areas from survey responses. A metro with few painters can carry a wide margin of error. The published estimate is still the best public number, but do not treat it as precise to the dollar.
Pulling metro percentiles for your market
Start at the Overview of BLS Statistics by Occupation : U.S. Bureau of Labor Statistics, which indexes every occupation-based program in one place. From there you reach OEWS tables, the Handbook, state wage data and the glossary.
OEWS publishes for metropolitan statistical areas, usually abbreviated MSA. A metro is a city plus its surrounding counties, so it does not stop at the city limit. Dallas-Fort Worth, Phoenix-Mesa, Denver-Aurora and Tampa-St. Petersburg are single metro areas in the tables, each containing dozens of cities.
Many rural counties never get their own MSA row. The tables fold them into a balance-of-state category, the nonmetropolitan portion of Texas or Kentucky or Montana. That figure usually runs below the metro number. Use it when you recruit in those counties, and expect to pay less than a Dallas or Austin scale.
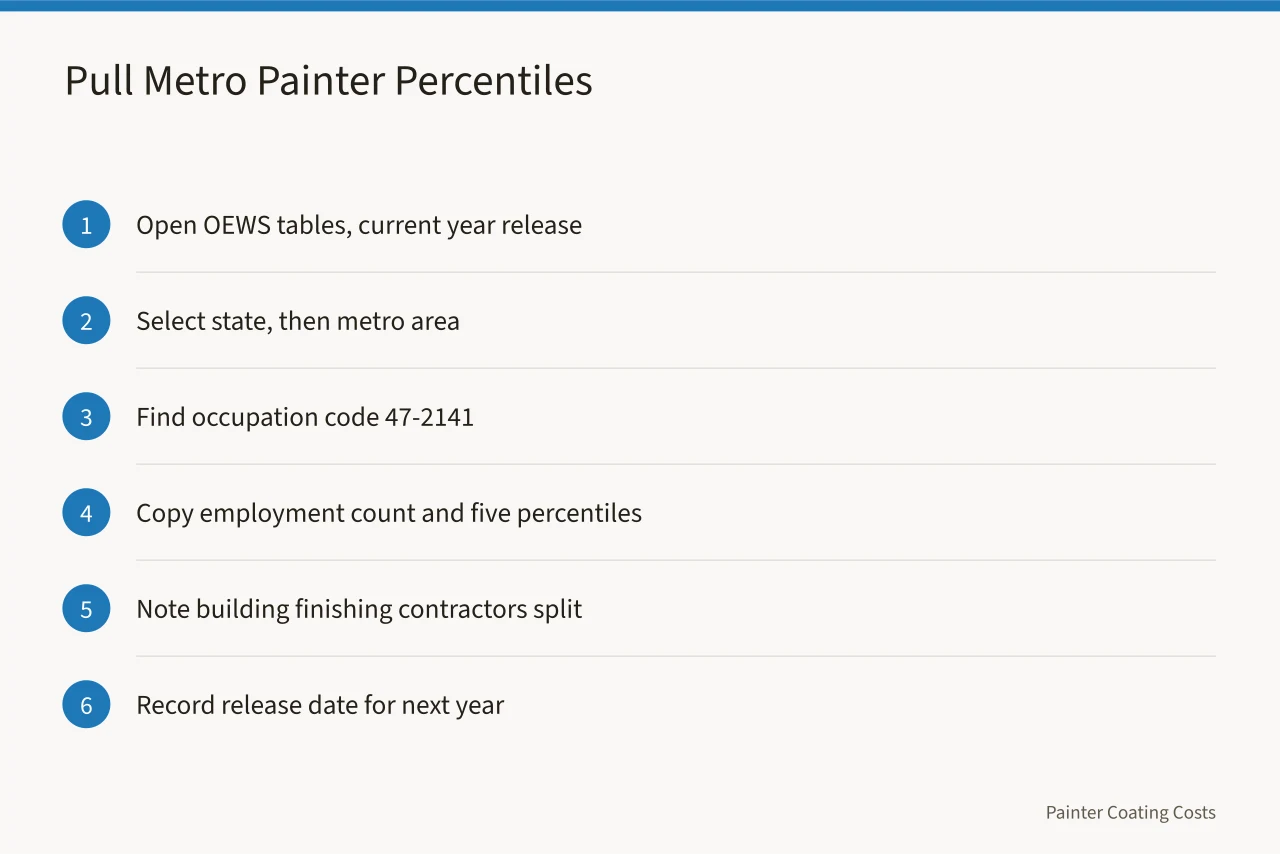
- Open the OEWS tables page and choose the current year release.
- Select your state, then your metro area from the geographic list.
- Find occupation code 47-2141 in the painter and coating workers row.
- Copy the employment count and the 10th, 25th, median, 75th and 90th percentile hourly wages.
- Note the industry split for building finishing contractors if your area shows one.
- Record the release date, because you will compare against it next year.
Run that for two or three metros if you recruit across a region. Austin and San Jose differ enough that one scale will not serve both. The same is true across these states:
- Florida
- New York
- Illinois
- Arizona
- Colorado
- Washington
Compare your metro median to the national median. Above it, you are in a high-wage market and your bids have to reflect that. Below it, you can hire at a lower base, but you also compete against lower-priced bids from other contractors.
Check the location quotient. A high quotient means painters are concentrated near you, so the labor pool is deep and turnover is easier to manage. A low quotient means you recruit from outside the trade or train from scratch, which changes how you structure the entry band.
Then look at two or three releases in a row. A metro whose median has climbed steadily needs a scale that anticipates another increase. A flat metro lets you hold bands longer. The Glossary : U.S. Bureau of Labor Statistics defines percentile, median and the other labels if one is unclear.
From percentile to pay bands
A pay scale turns market percentiles into internal bands. Each band has a minimum, a midpoint and a maximum. Painters move up a band as they gain skill and between bands when they take on more responsibility.
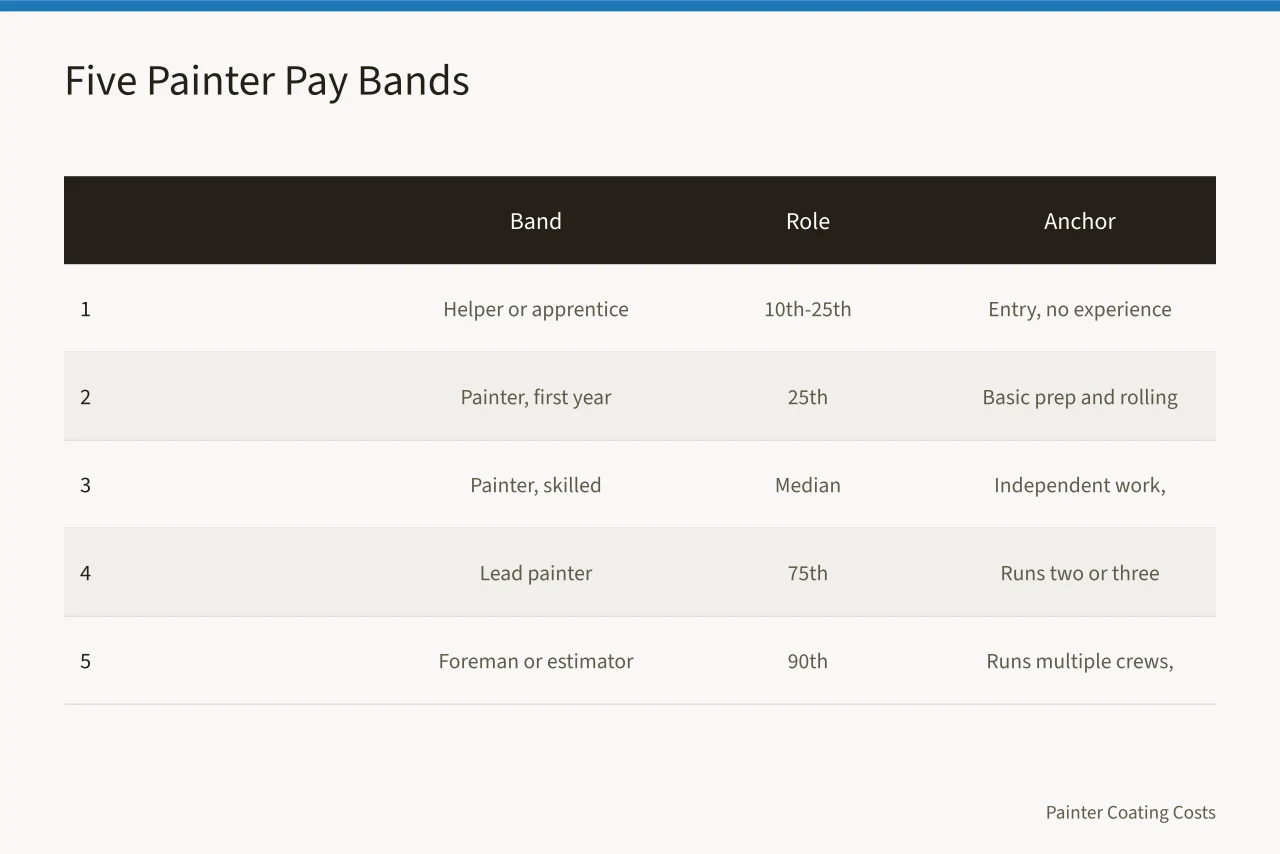
Five bands fit most painting companies, and each one anchors to an OEWS percentile so the scale stays tied to market data rather than to last year's payroll.
| Band | Typical role | Anchor percentile | Use |
|---|---|---|---|
| 1 | Helper or apprentice | 10th to 25th | Entry, no experience |
| 2 | Painter, first year | 25th | Basic prep and rolling |
| 3 | Painter, skilled | Median | Independent work, spray |
| 4 | Lead painter | 75th | Runs a two or three person crew |
| 5 | Foreman or estimator | 90th | Runs multiple crews, bids jobs |
Set each band minimum at the lower percentile and the maximum roughly 15 to 20 percent above it. That spread lets you reward a strong performer without promoting them. Overlapping bands make it hard to explain why one painter earns more than another.
Write down what moves a painter up. Years in the trade, spray and coating certifications, lead-safe certification under the EPA Lead Renovation, Repair and Painting Rule, and the ability to run a crew unsupervised are the usual criteria. Put them in the document so reviews are not subjective.
Add a geographic differential if you work in more than one market. A band 4 painter in the San Jose or New York metro needs a dollar figure well above the same band in Tucson or McAllen, and the tables show that gap every year. Keep the structure identical so transfers stay simple.
Build in a training rate for new hires who have never painted commercially. Many owners pay a percentage of band 1 for the first 60 to 90 days, then move the worker to full band 1 or band 2. You find out whether the person lasts without paying full rate to learn it.
Compare the finished scale to what you pay today. If several painters sit above their band maximum, you have compression. Fix it by raising the band or moving the person into a higher band with more responsibility, not by cutting pay.
This is also where the scale meets your overall pay rates and labor costs. A scale that looks fair against the market but sinks your gross margin is not one you can keep.
Turning the scale into a bid labor rate
A pay scale is an internal document. A bid labor rate is what you charge for an hour of painter time in an estimate. Confusing the two is how painting contractor rates end up too low on jobs you win.
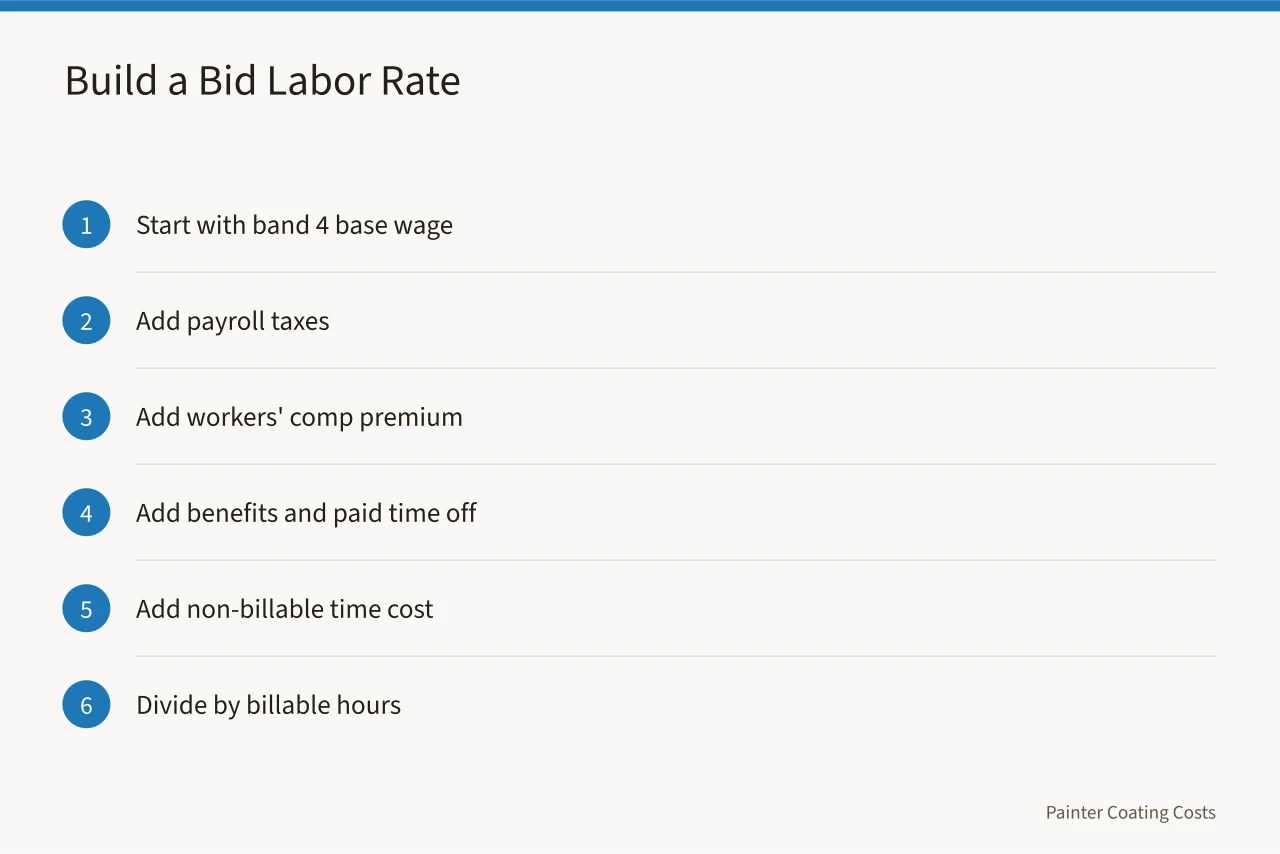
The build-up starts with the band wage and adds every cost of employing that person. Payroll taxes, workers' compensation, general liability, benefits, paid time off and non-billable time all belong in the rate. So does the cost of hours a painter spends driving, loading and cleaning up.
Work through it for a lead painter at a band 4 wage.
- Start with the band 4 base wage, say the 75th percentile for your metro.
- Add payroll taxes: Social Security, Medicare, federal and state unemployment.
- Add workers' compensation premium for the painting classification.
- Add benefits, paid holidays and paid time off.
- Add the cost of non-billable time, often 10 to 20 percent of paid hours.
- Divide the total by the billable hours you expect that painter to produce.
The result is your true cost per billable hour. That number, not the base wage, is what your estimate uses. Bill at the base wage and you absorb every employment cost out of margin.
Non-billable time is the item owners miss most. A painter paid for 40 hours may produce 32 billable hours once you subtract travel, material runs, equipment maintenance and shop time. A rate that assumes 40 billable hours understates effective labor cost by roughly a quarter.
Workers' compensation is regulated state by state, and painting carries its own classification rate in each one. California, New York, Illinois and Washington set rates through state filings and assigned-risk markets, and those premiums often run above what a Texas contractor pays, since Texas lets most employers opt out of workers' comp entirely.
Get your own carrier rate rather than borrowing a neighbor's.
Once you have cost per billable hour, add overhead recovery and target profit. Overhead includes the office, vehicles, insurance, software and the owner's salary. Profit is what remains after everything is paid. Both are easier to defend when the labor number underneath is accurate.
This is where the wage scale and your margin math meet. A rate built from a real scale and a real burden number can be explained to a customer. A rate pulled from thin air cannot, and it usually ends up too low.
Where QCEW and cost data fill the gaps
The Quarterly Census of Employment and Wages : U.S. Bureau of Labor Statistics counts jobs and wages that employers report to state unemployment insurance programs. It covers roughly 95 percent of U.S. jobs, including the self-employed only when they are on a payroll. For painting contractors it shows employment and average weekly wages by industry and county.
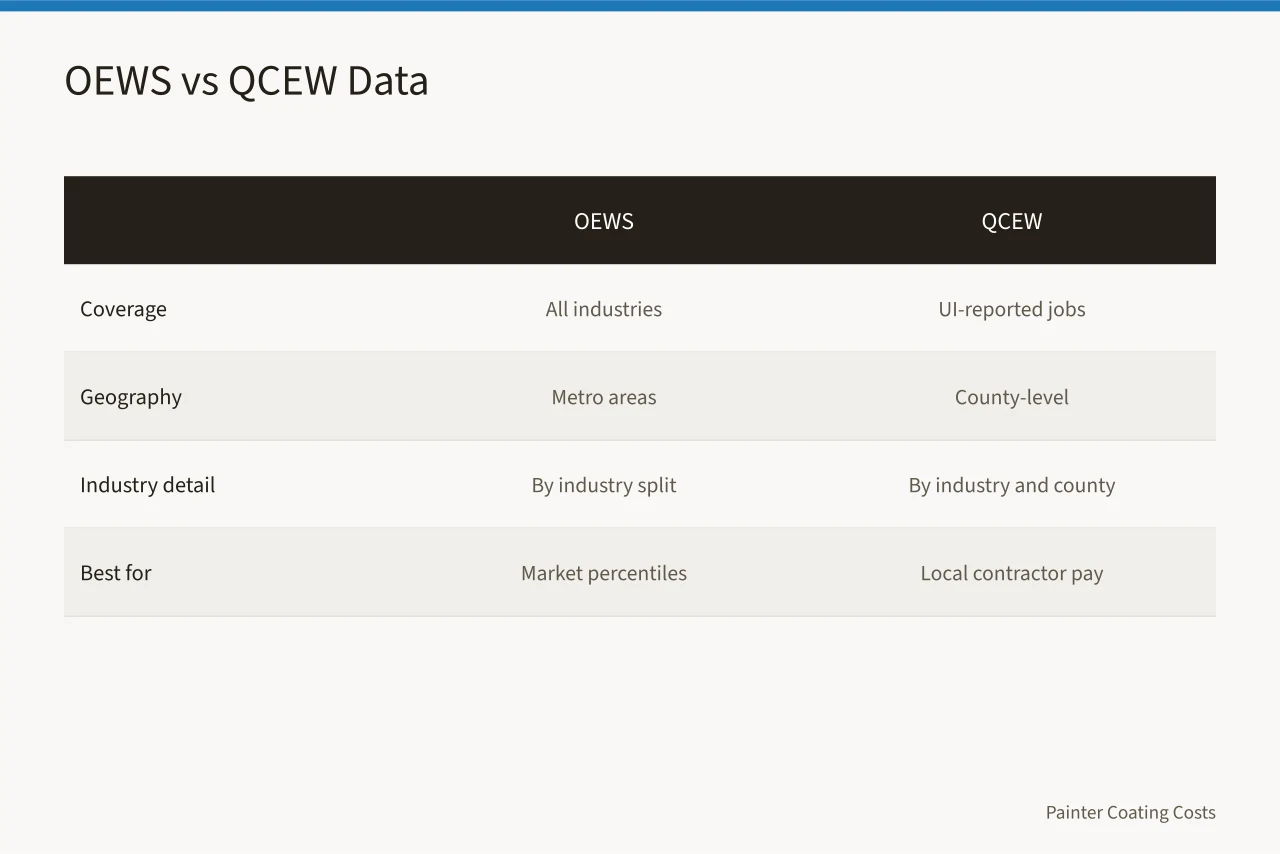
QCEW answers a question OEWS cannot. OEWS tells you what painters earn across all industries. QCEW tells you what painting contractors in your county report paying. A scale far below the QCEW average for your industry and area will not hire.
QCEW is also more granular geographically and more current in some areas. Pull county figures for your home market and compare them to the metro OEWS numbers. When the two disagree, trust the one that matches your hiring reality and find out why.
Use QCEW to check total payroll too. If annual payroll divided by headcount sits far below the county average for painting contractors, either your crew is unusually junior or your pay is behind the market. Both are signals to revisit the scale.
Compliance costs belong in overhead, and they vary by authority. OSHA rules govern fall protection, scaffolding and respiratory protection for spray work.
The EPA Lead Renovation, Repair and Painting Rule requires certified firms and trained renovators on pre-1978 housing, which shapes how a painting contractor business hires and trains its crews.
Confirm current requirements with OSHA, the EPA and a certified training provider rather than from a secondhand summary.
State contractor licensing boards set their own requirements, and the rules differ enough that a scale built in one state does not transfer cleanly to another. Check with your own state board before you post a wage tied to a license requirement.
How you pay people changes the burden. Employees get a W-2 and you withhold taxes. Independent contractors get a Form 1099-NEC and file Schedule C.
Misclassifying a painter to avoid burden is a costly mistake, and the burden you avoided does not disappear from your true labor cost.
The IRS publishes the worker classification tests; a qualified attorney or tax professional applies them to your facts.
Reviewing the scale each year
Set a review date and keep it. The new OEWS release usually lands in the spring, and QCEW publishes quarterly with a lag. Put both on your calendar so the review happens before you set next year's prices.
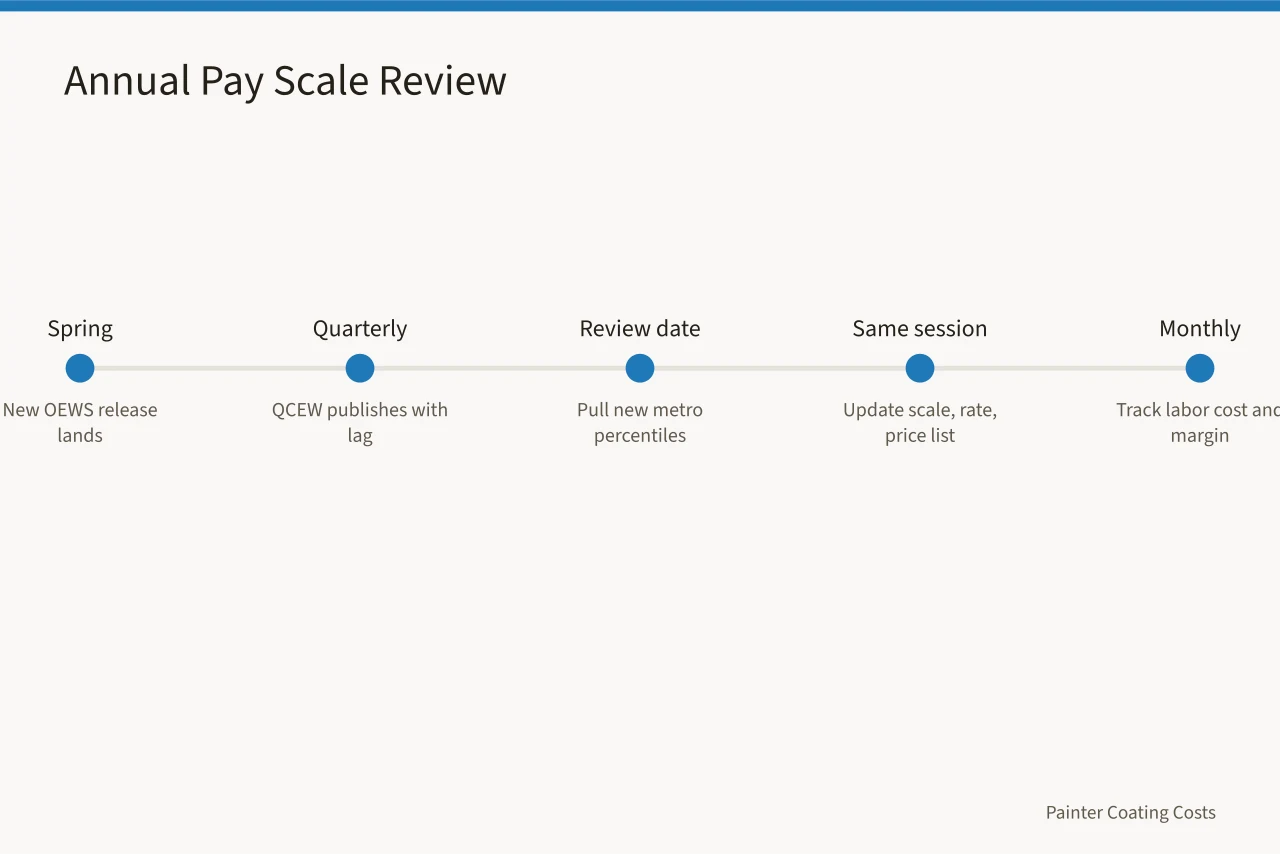
Start by pulling the new metro percentiles for occupation 47-2141. Compare them to last year's numbers. If the median moved up, your bands move with it, at least for the bands where you actually hire.
Check turnover and applicant flow. If a band 2 opening will not fill at the posted rate, the market is telling you the rate is low no matter what the table says. If overqualified applicants flood in, you may be paying above market for the role.
Review the burden side too. Workers' compensation rates, health insurance and payroll tax thresholds change. A rate that covered your costs last year may not cover them this year even with wages flat.
Update the pay scale, the bid labor rate and your price list in the same session. Doing them separately invites inconsistency. When the scale moves, the rate moves, and the prices you quote move with it.
Then track the results. A wage scale is a management tool, not a filing cabinet document. The companies that get this right are the ones that measure every month: labor cost per job, gross margin by crew, turnover by band. Those numbers tell you whether the scale is working long before the next BLS release.
If the scale and the rate move together and the results hold, the next review is easier. If they drift apart, fix the burden assumptions before you raise prices.
Common questions
What is the BLS occupation code for painters?
It is 47-2141, painters and coating workers, construction and maintenance. Use that code in OEWS and QCEW tables to find wage and employment data for your market.
Should I pay the median or the 75th percentile?
Pay the median for a painter who works independently and the 75th for a lead who runs a crew. Paying below the 25th makes hiring hard in most metros.
How often does OEWS data update?
OEWS publishes annually, usually in the spring, with data collected over the prior year. QCEW publishes quarterly with a lag of several months, so the two never line up exactly.
Do I include benefits in the bid labor rate?
Yes. Payroll taxes, workers' compensation, benefits and non-billable time all belong in the burden you add to the base wage before you divide by billable hours.